Semi-Supervised Classification with Graph Convolutional Networks
Semi-Supervised Classification with Graph Convolutional Networks
Problem
Framing
Semi-supervised node classification on graphs lacked a simple model that used both node features and graph structure at full-graph scale. The paper closes this gap with a first-order spectral approximation that becomes a two-layer graph convolution and reaches 81.5% on Cora.
Currently Used Methods
Foundational
- Spectral Networks and Locally Connected Networks on Graphs — spectral graph CNNs with Chebyshev polynomial filters.
- Limitation in context: higher-order filters cost more and complicate semi-supervised full-graph training.
- Planetoid: Revisiting Semi-Supervised Learning with Graph Embeddings — joint graph embeddings and label prediction.
- Limitation in context: weaker direct neighborhood propagation than GCN's normalized message passing.
- DeepWalk: Online Learning of Social Representations — unsupervised random-walk node embeddings.
- Limitation in context: ignores node features and underperforms on label-scarce classification.
- Learning with Local and Global Consistency — label propagation over graph structure.
- Limitation in context: cannot learn feature transforms from input attributes.
- Iterative Classification Algorithm — relational classification with iterative neighbor label updates.
- Limitation in context: lacks end-to-end differentiable feature aggregation.
Proposed Method
Architecture
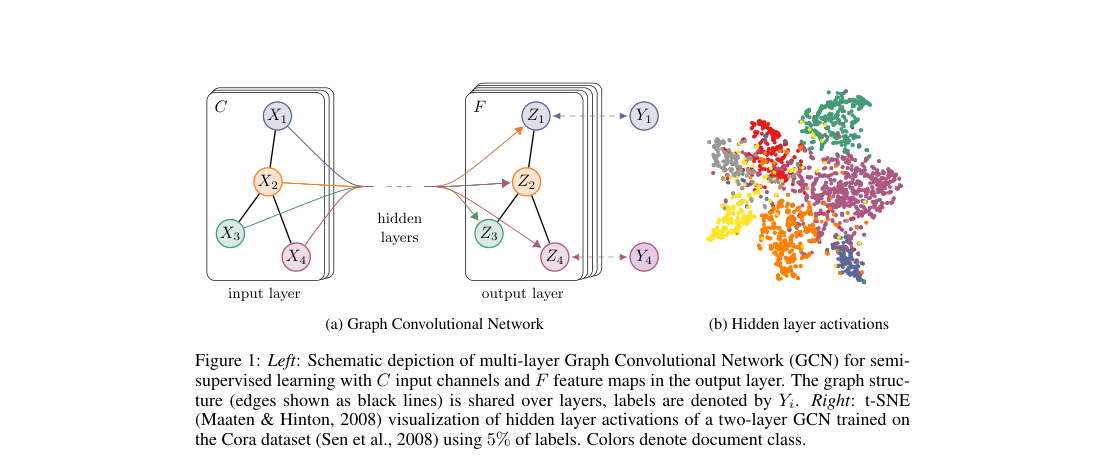
The model uses a full-batch two-layer GCN on a symmetric graph. Inputs are node features , propagation uses with , and outputs are class probabilities.
Loss / Objective
The paper trains the two-layer network with supervised cross-entropy on labeled nodes only.
Sampling Rule / Algorithm
Each layer applies the renormalized neighborhood mixing rule.
Training Procedure
- Layers: 2
- Hidden units: 16
- Optimizer: Adam
- Learning rate: 0.01
- Dropout: 0.5
- weight decay: on first layer
- Training mode: full-batch gradient descent
- Citation-network labels: 20 per class for training, 500 validation, 1000 test
Evaluation
Datasets
- Citeseer citation network
- Cora citation network
- Pubmed citation network
- NELL knowledge graph
Metrics
- Classification accuracy (%)
- Training time to convergence
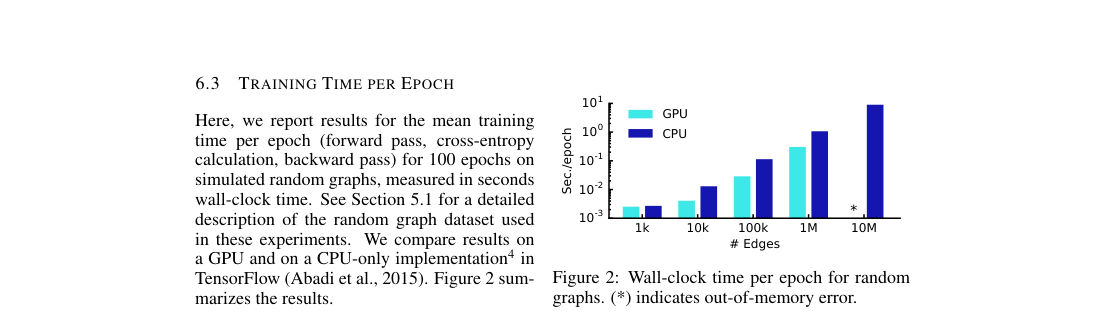
- Wall-clock time per epoch on random graphs
Headline results
- Citeseer: 70.3% accuracy
- Cora: 81.5% accuracy
- Pubmed: 79.0% accuracy
- NELL: 66.0% accuracy
Ablations
- Propagation rule: the renormalization trick is the strongest or tied-strongest variant across citation datasets.
- Model depth: best accuracy appears at 2–3 layers; deeper plain GCNs degrade.
- Residual connections: stabilize deeper models in depth experiments.
- Runtime scaling: per-epoch cost stays practical on large sparse random graphs, especially on GPU.
Table 1: Dataset statistics used in the main experiments.
| Dataset | Type | Nodes | Edges | Classes | Features | Label rate |
|---|---|---|---|---|---|---|
| Citeseer | Citation network | 3,327 | 4,732 | 6 | 3,703 | 0.036 |
| Cora | Citation network | 2,708 | 5,429 | 7 | 1,433 | 0.052 |
| Pubmed | Citation network | 19,717 | 44,338 | 3 | 500 | 0.003 |
| NELL | Knowledge graph | 65,755 | 266,144 | 210 | 5,414 | 0.001 |
Method Strengths and Weaknesses
Strengths
- Reduces spectral graph convolutions to a simple sparse propagation rule.
- Uses both node features and graph structure in one end-to-end model.
- Beats prior baselines on Citeseer, Cora, Pubmed, and NELL.
- Full-batch training scales linearly in edges with sparse adjacency.
Weaknesses
- Assumes an undirected graph in its native formulation.
- Full-batch training requires the whole graph in memory.
- Deeper plain GCNs degrade beyond roughly 3 layers.
- Edge features are unsupported without graph transformation tricks.
Suggestions from the authors
- Extend the framework to directed graphs without bipartite reformulation.
- Incorporate edge features into the propagation operator.
- Scale training beyond in-memory full-batch optimization.
- Improve very deep GCN training with better architectural stabilization.
Links
Prior Papers
No prior vault papers identified yet.
Further Papers
- @hamiltonGraphSAGE2017 — extends neighborhood aggregation to inductive node representation learning on unseen graphs.
- @velickovicGAT2018 — replaces fixed normalized averaging with learned attention over graph neighborhoods.