Graph Attention Networks
velickovicGAT2018
Problem
Framing
Graph convolutions on irregular neighborhoods either hard-code uniform weights or require costly spectral machinery. GAT closes this gap with masked self-attention over each node's neighbors, learning edge-wise importance without eigendecompositions or fixed-degree assumptions. On Cora it reaches 84.4% accuracy.
Currently Used Methods
Foundational
- @kipfGCN2017 — first-order graph convolution for semi-supervised node classification.
- Limitation in context: uses fixed normalized aggregation, so neighbors cannot receive adaptive weights.
- @hamiltonGraphSAGE2017 — inductive neighborhood aggregation with sampled message passing.
- Limitation in context: sampled aggregators weaken full-neighborhood weighting and still lack explicit attention.
- @vaswaniAttentionAllNeed2017 — multi-head self-attention as a content-adaptive aggregation primitive.
- Limitation in context: designed for sequences; it does not define sparse neighborhood attention on graphs.
- "Semi-Supervised Classification with Graph Convolutional Networks" — localized spectral filtering on citation graphs.
- Limitation in context: requires pre-specified graph normalization instead of learned neighbor importances.
- "GraphSAGE: Inductive Representation Learning on Large Graphs" — inductive node embeddings across unseen graphs.
- Limitation in context: aggregation functions are less expressive than learned edge-specific coefficients.
Proposed Method
Architecture
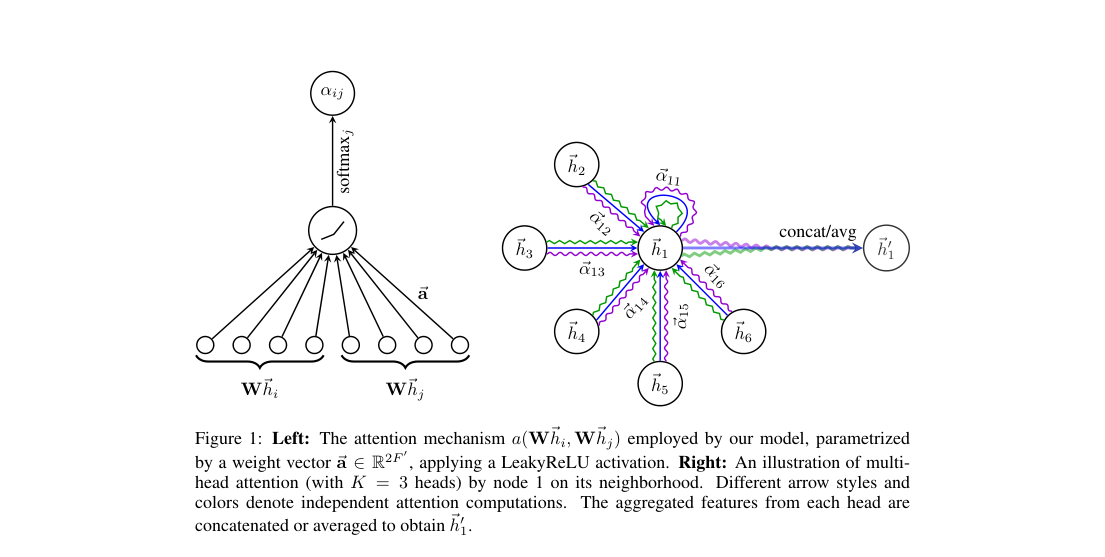
A GAT layer linearly projects node features with , scores each edge by a shared attention MLP, normalizes scores over , then aggregates neighbors with the learned weights. Transductive models use two layers with heads of features, then one output head per class; inductive PPI models use three layers with heads.
Loss / Objective
The model trains with supervised node classification over the final logits.
Sampling Rule / Algorithm
Each layer computes normalized neighbor weights, then a weighted neighborhood sum; multi-head outputs are concatenated in hidden layers and averaged at the output.
Training Procedure
- Optimizer: Adam.
- Learning rate: .
- regularization: .
- Dropout on inputs and normalized attention coefficients: .
- Attention LeakyReLU negative slope: .
- Early stopping patience: epochs.
- Transductive heads/features: , first layer.
- Inductive heads/features: , in first two layers.
Evaluation
Datasets
- Cora: transductive citation network, 2,708 nodes.
- Citeseer: transductive citation network, 3,327 nodes.
- Pubmed: transductive citation network, 19,717 nodes.
- PPI: inductive protein-protein interaction graphs, 56,944 nodes over 24 graphs.
Metrics
- Citation graphs: mean test classification accuracy.
- PPI: micro-averaged .
Headline results
- Cora (transductive): 84.4% accuracy.
- Citeseer (transductive): 72.5% accuracy.
- Pubmed (transductive): 79.0% accuracy.
- PPI (inductive): 0.973 micro-.
- PPI vs GraphSAGE baseline: 0.973 vs 0.768 micro-.
Ablations
- Multi-head attention: stabilizes training and improves aggregation quality.
- Constant attention vs learned attention: learned coefficients materially improve PPI micro-.
- Full-neighborhood aggregation vs GraphSAGE sampling: full aggregation performs better on PPI.
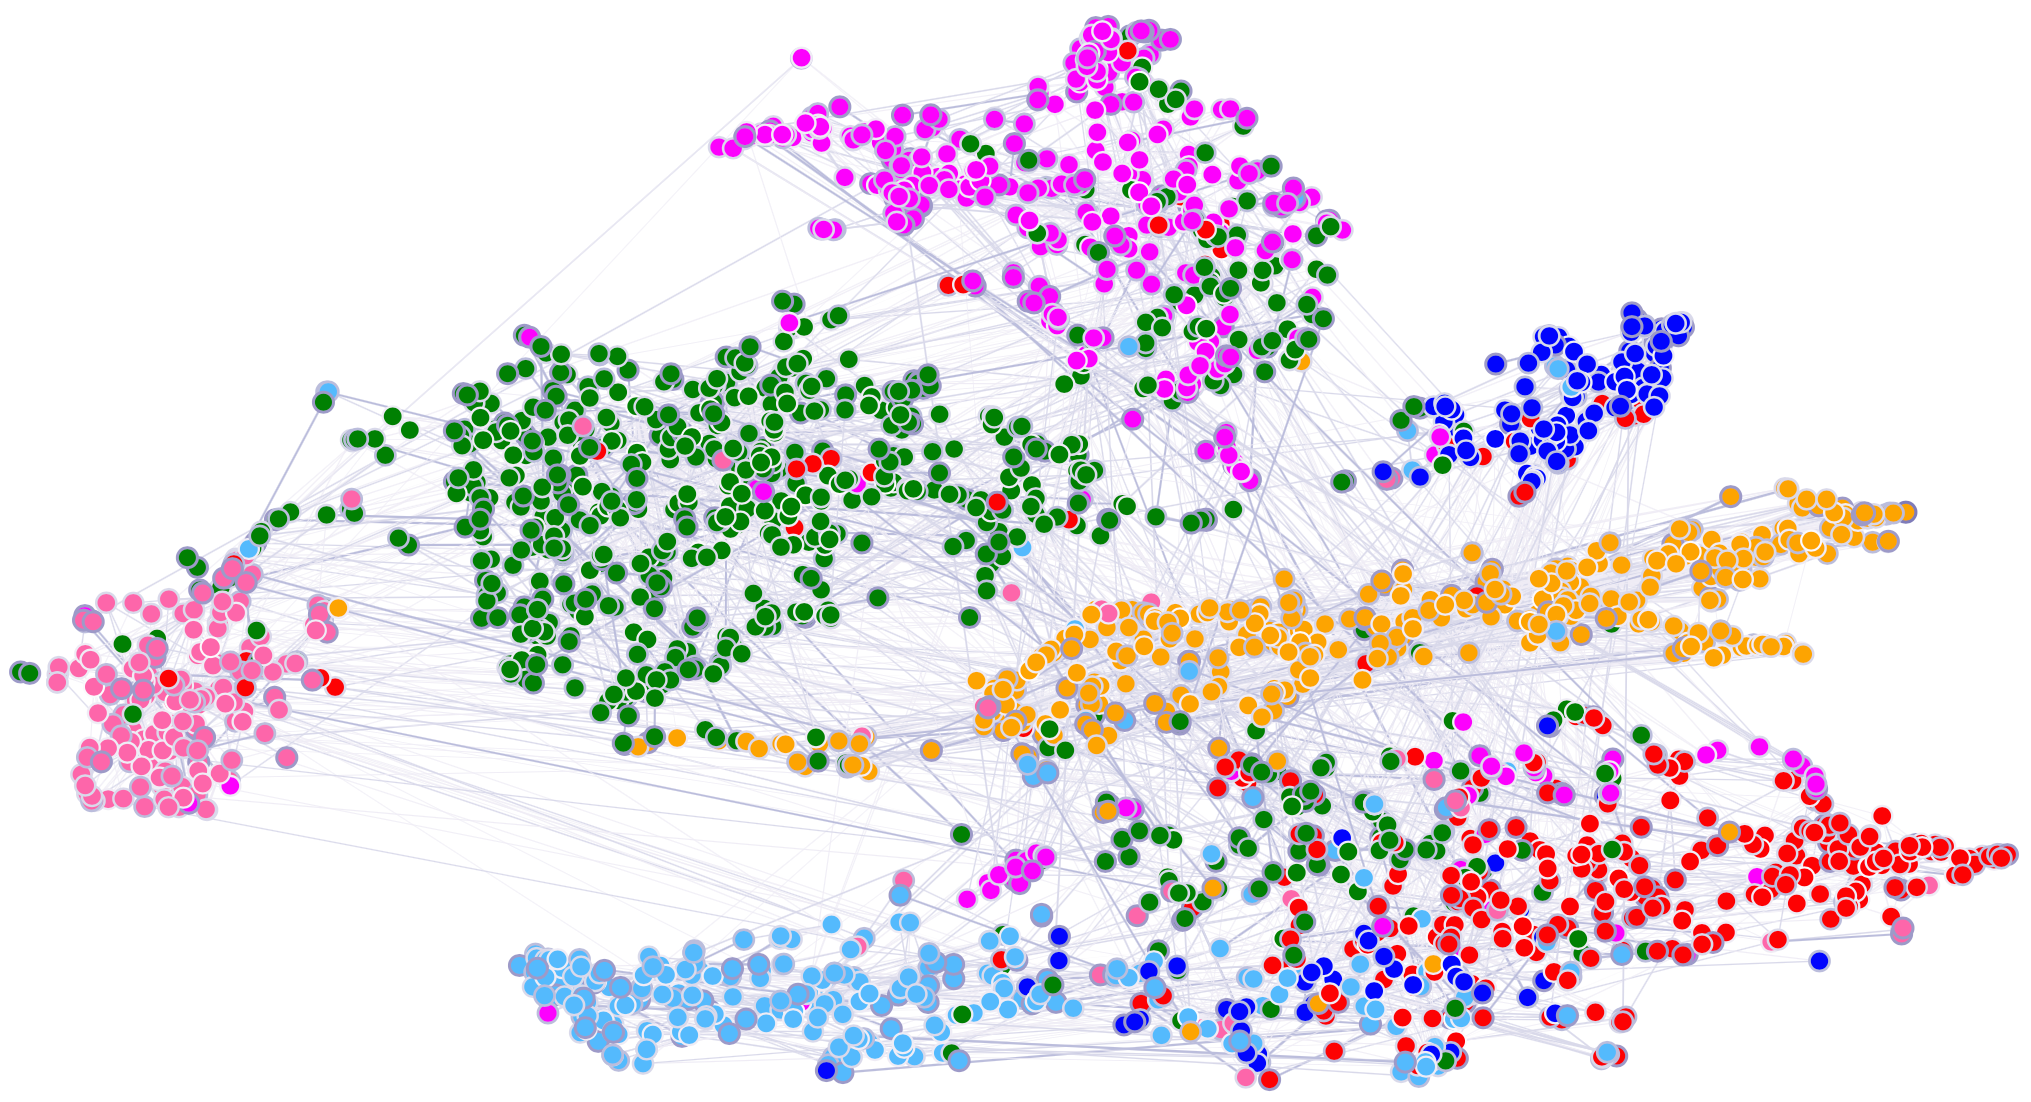
- Qualitative embedding analysis: first-layer Cora features form cleaner class clusters.
Method Strengths and Weaknesses
Strengths
- Learns node-specific neighbor weights instead of fixed normalized averaging.
- Matches or exceeds prior accuracy on Cora, Citeseer, Pubmed, and PPI.
- Works in both transductive and inductive settings with one layer primitive.
- Avoids eigendecompositions; per-head cost stays comparable to prior spatial methods.
Weaknesses
- Practical batching issues limit scaling to larger graphs.
- Reported gains on citation benchmarks are modest over strong GCN baselines.
- Attention interpretation remains qualitative, not quantitatively validated.
- Uses full neighborhoods; memory can grow with high-degree nodes.
Suggestions from the authors
- Overcome batching bottlenecks to handle larger graphs.
- Use attention weights for deeper interpretability analysis.
- Extend the model from node classification to graph classification.
- Incorporate edge features to model relations more explicitly.
Links
Prior Papers
- @kipfGCN2017 — GAT replaces GCN's fixed normalized neighborhood averaging with learned attention weights.
- @hamiltonGraphSAGE2017 — GAT is evaluated directly against GraphSAGE in the inductive PPI setting.
- @vaswaniAttentionAllNeed2017 — GAT imports multi-head attention into sparse graph neighborhood aggregation.
Further Papers
No vault papers identified as further work yet.